







The warmest on record
The past ten years are the ten warmest years on record[6].

This page is currently being updated.
Weather is what happens day to day: rain, wind and sun. The regular pattern of weather over many years is the climate.
Weather is what happens day to day (rain, wind, sun). The regular pattern of weather over many years is the climate[1].
The Earth can look huge from space, but what makes life possible is fragile: the thin layer of air, water, and ice we call our atmosphere. When we change the atmosphere, we change the rules for everything that depends on it.
Climate change means a long-term shift in global temperatures and weather patterns[1]. Global warming is one part of climate change: the increase in Earth’s average temperature.
The climate can change naturally due to changes in the solar cycle or large volcanic eruptions. But what worries scientists today is the speed and the cause of the change[2], [3]. Global temperature has increased faster since 1970 than in any other 50-year period in the past 2000 years[4], [5].
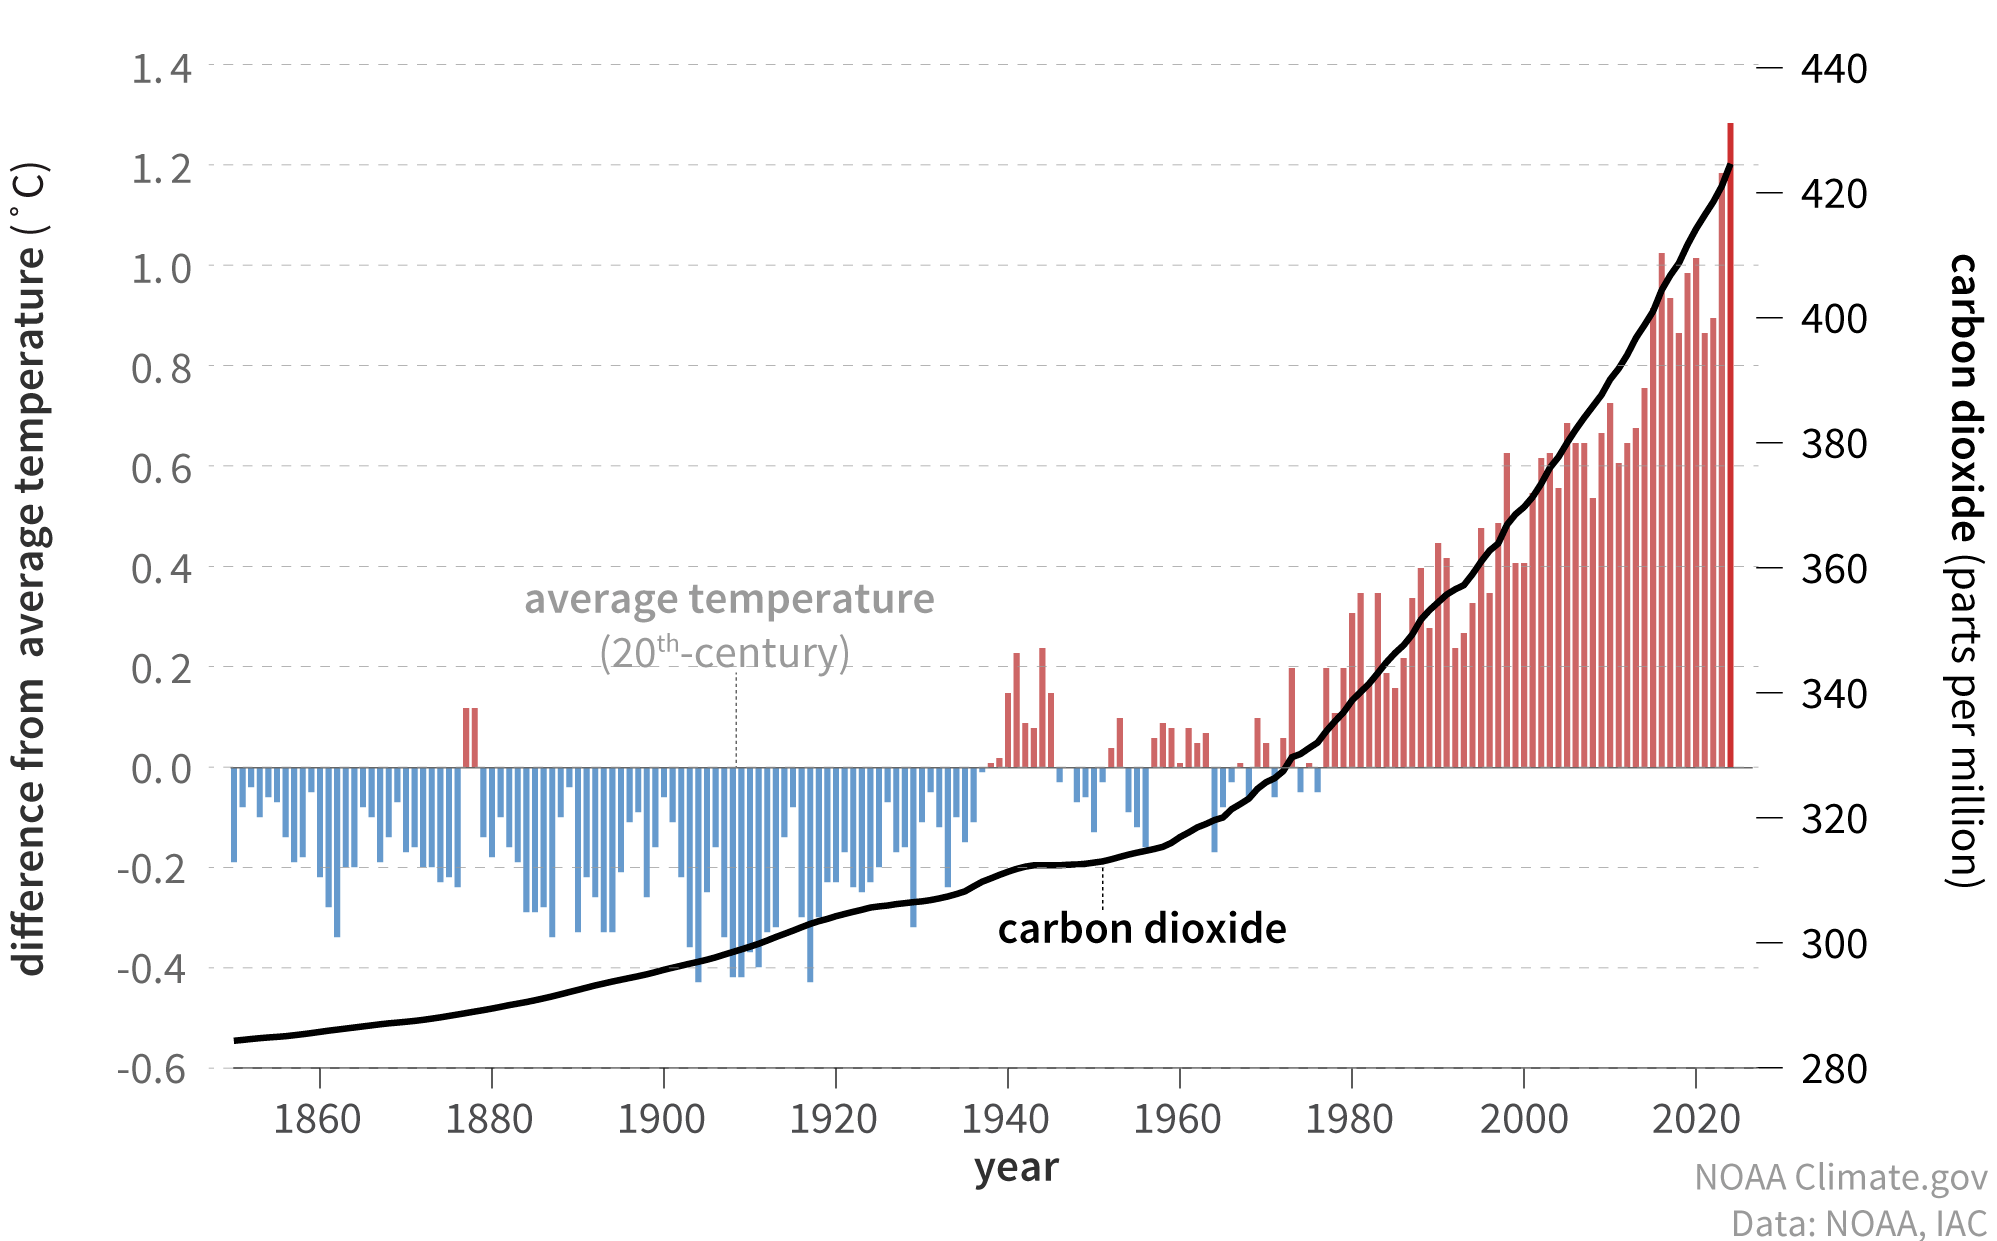
Measurements collected over many years show clear changes in temperature, carbon dioxide and sea level.
The past ten years are the ten warmest years on record[6].
The atmosphere now contains far more carbon dioxide than before the Industrial Revolution: about 422 ppm in 2024 compared to about 280 ppm in the 1800s[7], [8].
Global mean sea level increased by about 20-25 cm since 1900[9], [4].
Today’s long-term warming is mainly caused by greenhouse gas emissions from human activity[4], [2].
In 2023, carbon dioxide made up about 79% of UK greenhouse gas emissions by warming effect, and methane about 15%[11].
15%Burning fossil fuels (coal, oil, gas) for electricity, heating and transport releases greenhouse gases as byproducts of combustion.
Cutting down forests for timber and changing land use removes nature’s way of taking carbon dioxide out of the air and creates more carbon dioxide in the process.
Farming of animals for meat leads to release of methane from their digestion and manure.
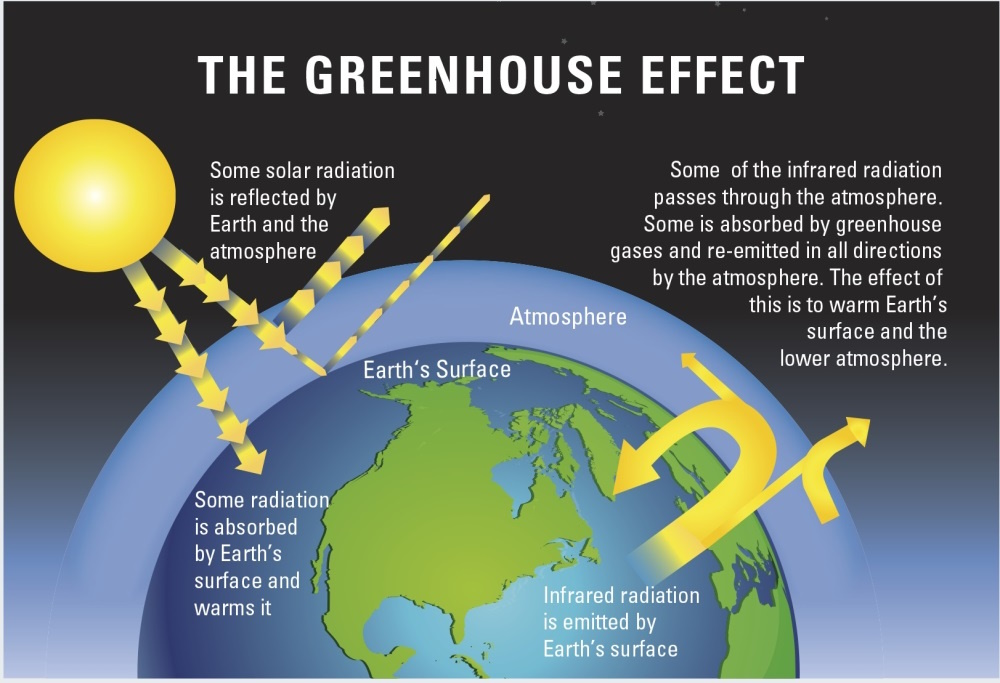
Greenhouse gases act like a blanket around the Earth. After the Sun warms Earth’s surface, the surface gives off energy as infrared radiation (heat). Greenhouse gases absorb some of this infrared radiation and then re-emit it in all directions, including back towards the surface, slowing heat escape into space[12].
It is good that we have some greenhouse gases in our atmosphere: they keep the planet warm enough for life. However, as human activities add more greenhouse gases, the greenhouse effect becomes stronger, so the planet’s average temperature increases[4], [12].
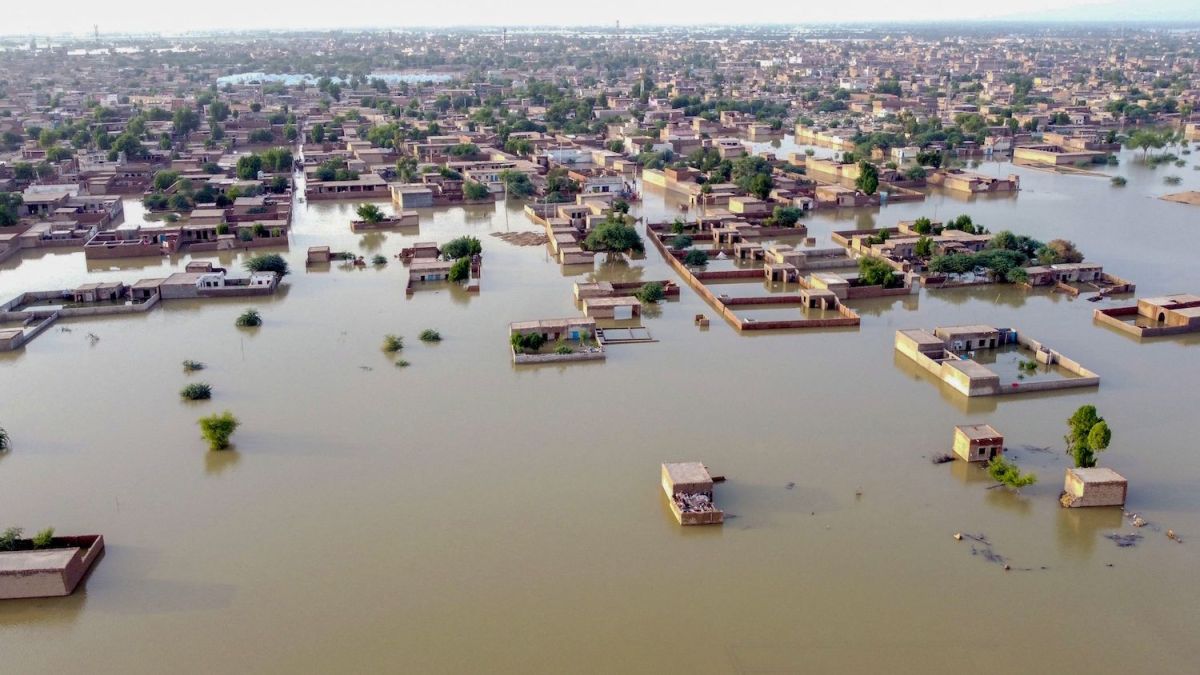
The effects of warming are felt everywhere: a warmer world makes extreme weather more likely and more severe[4].
Warmer air can hold more water vapour (about 7% more per 1 °C), which means storms can drop more rain in a short time[14]. Enormous rainfall in Pakistan in 2022 affected about 33 million people, with nearly 8 million displaced and more than 1,700 deaths[15], [16].
Warming increases evaporation, so land can dry out faster making heatwaves and droughts more intense[14]. In 2022, the UK reached 40.3 °C for the first time on record[18]. Across Europe that summer, researchers estimated about 61,672 heat-related deaths[19].
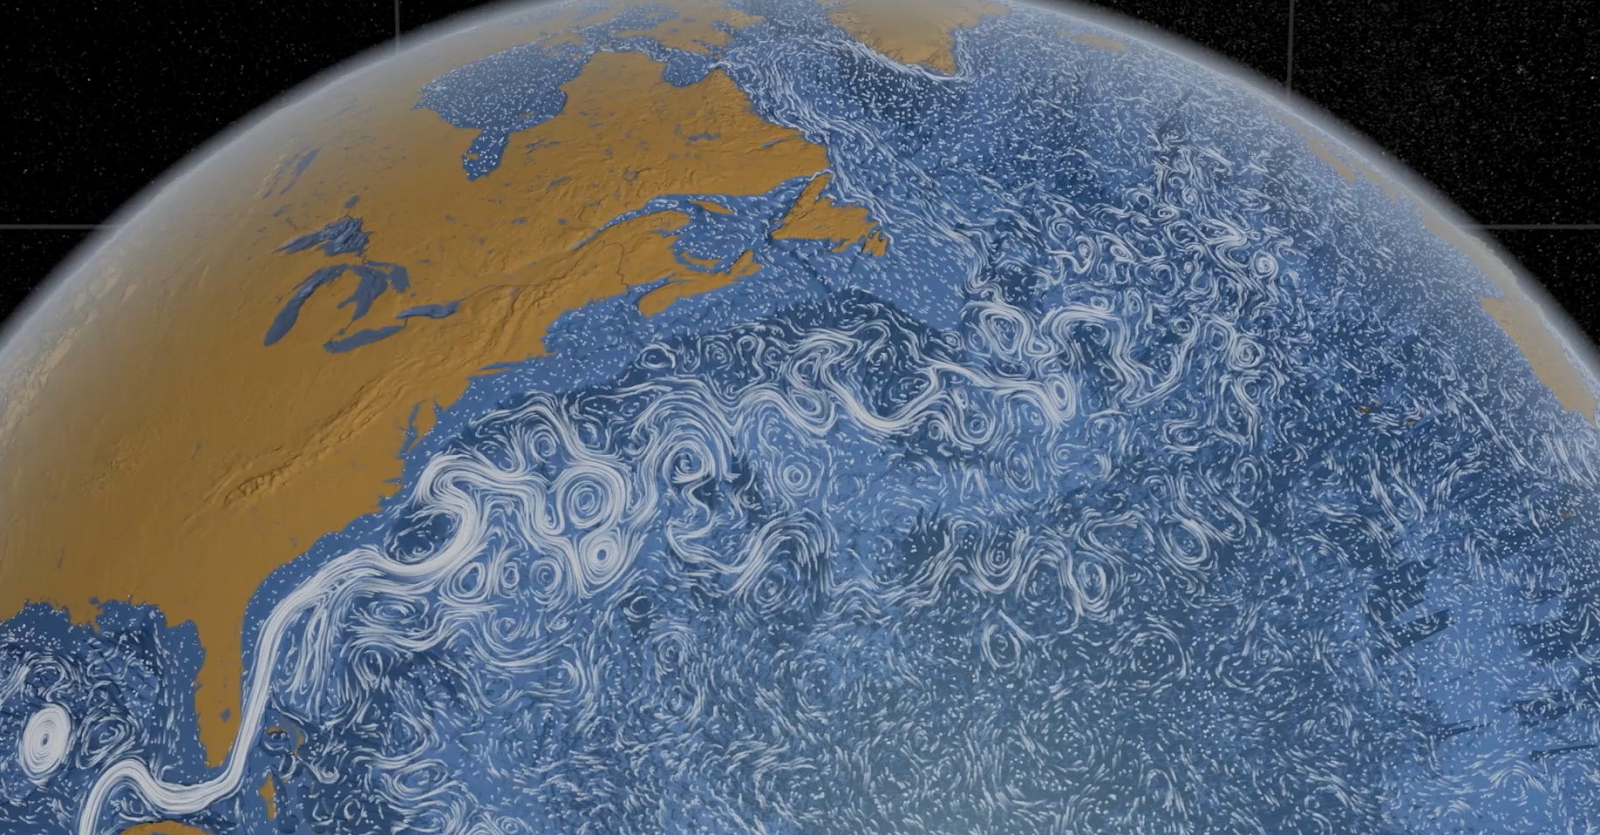
Our oceans are warming too, which combined with melting ice sheets, could hugely shift ocean circulation and the global weather systems that depend on it. These severe, long-term, global changes are called “tipping points”. We have not experienced a tipping point in human history, but many years ago, slower ocean circulations led to drastic cooling in Europe and global rainfall shifts that would be catastrophic for food production today. The greater the warming we cause, the more likely crossing tipping points becomes.
New technologies help researchers observe the oceans and ice sheets and give earlier warning of future tipping points.
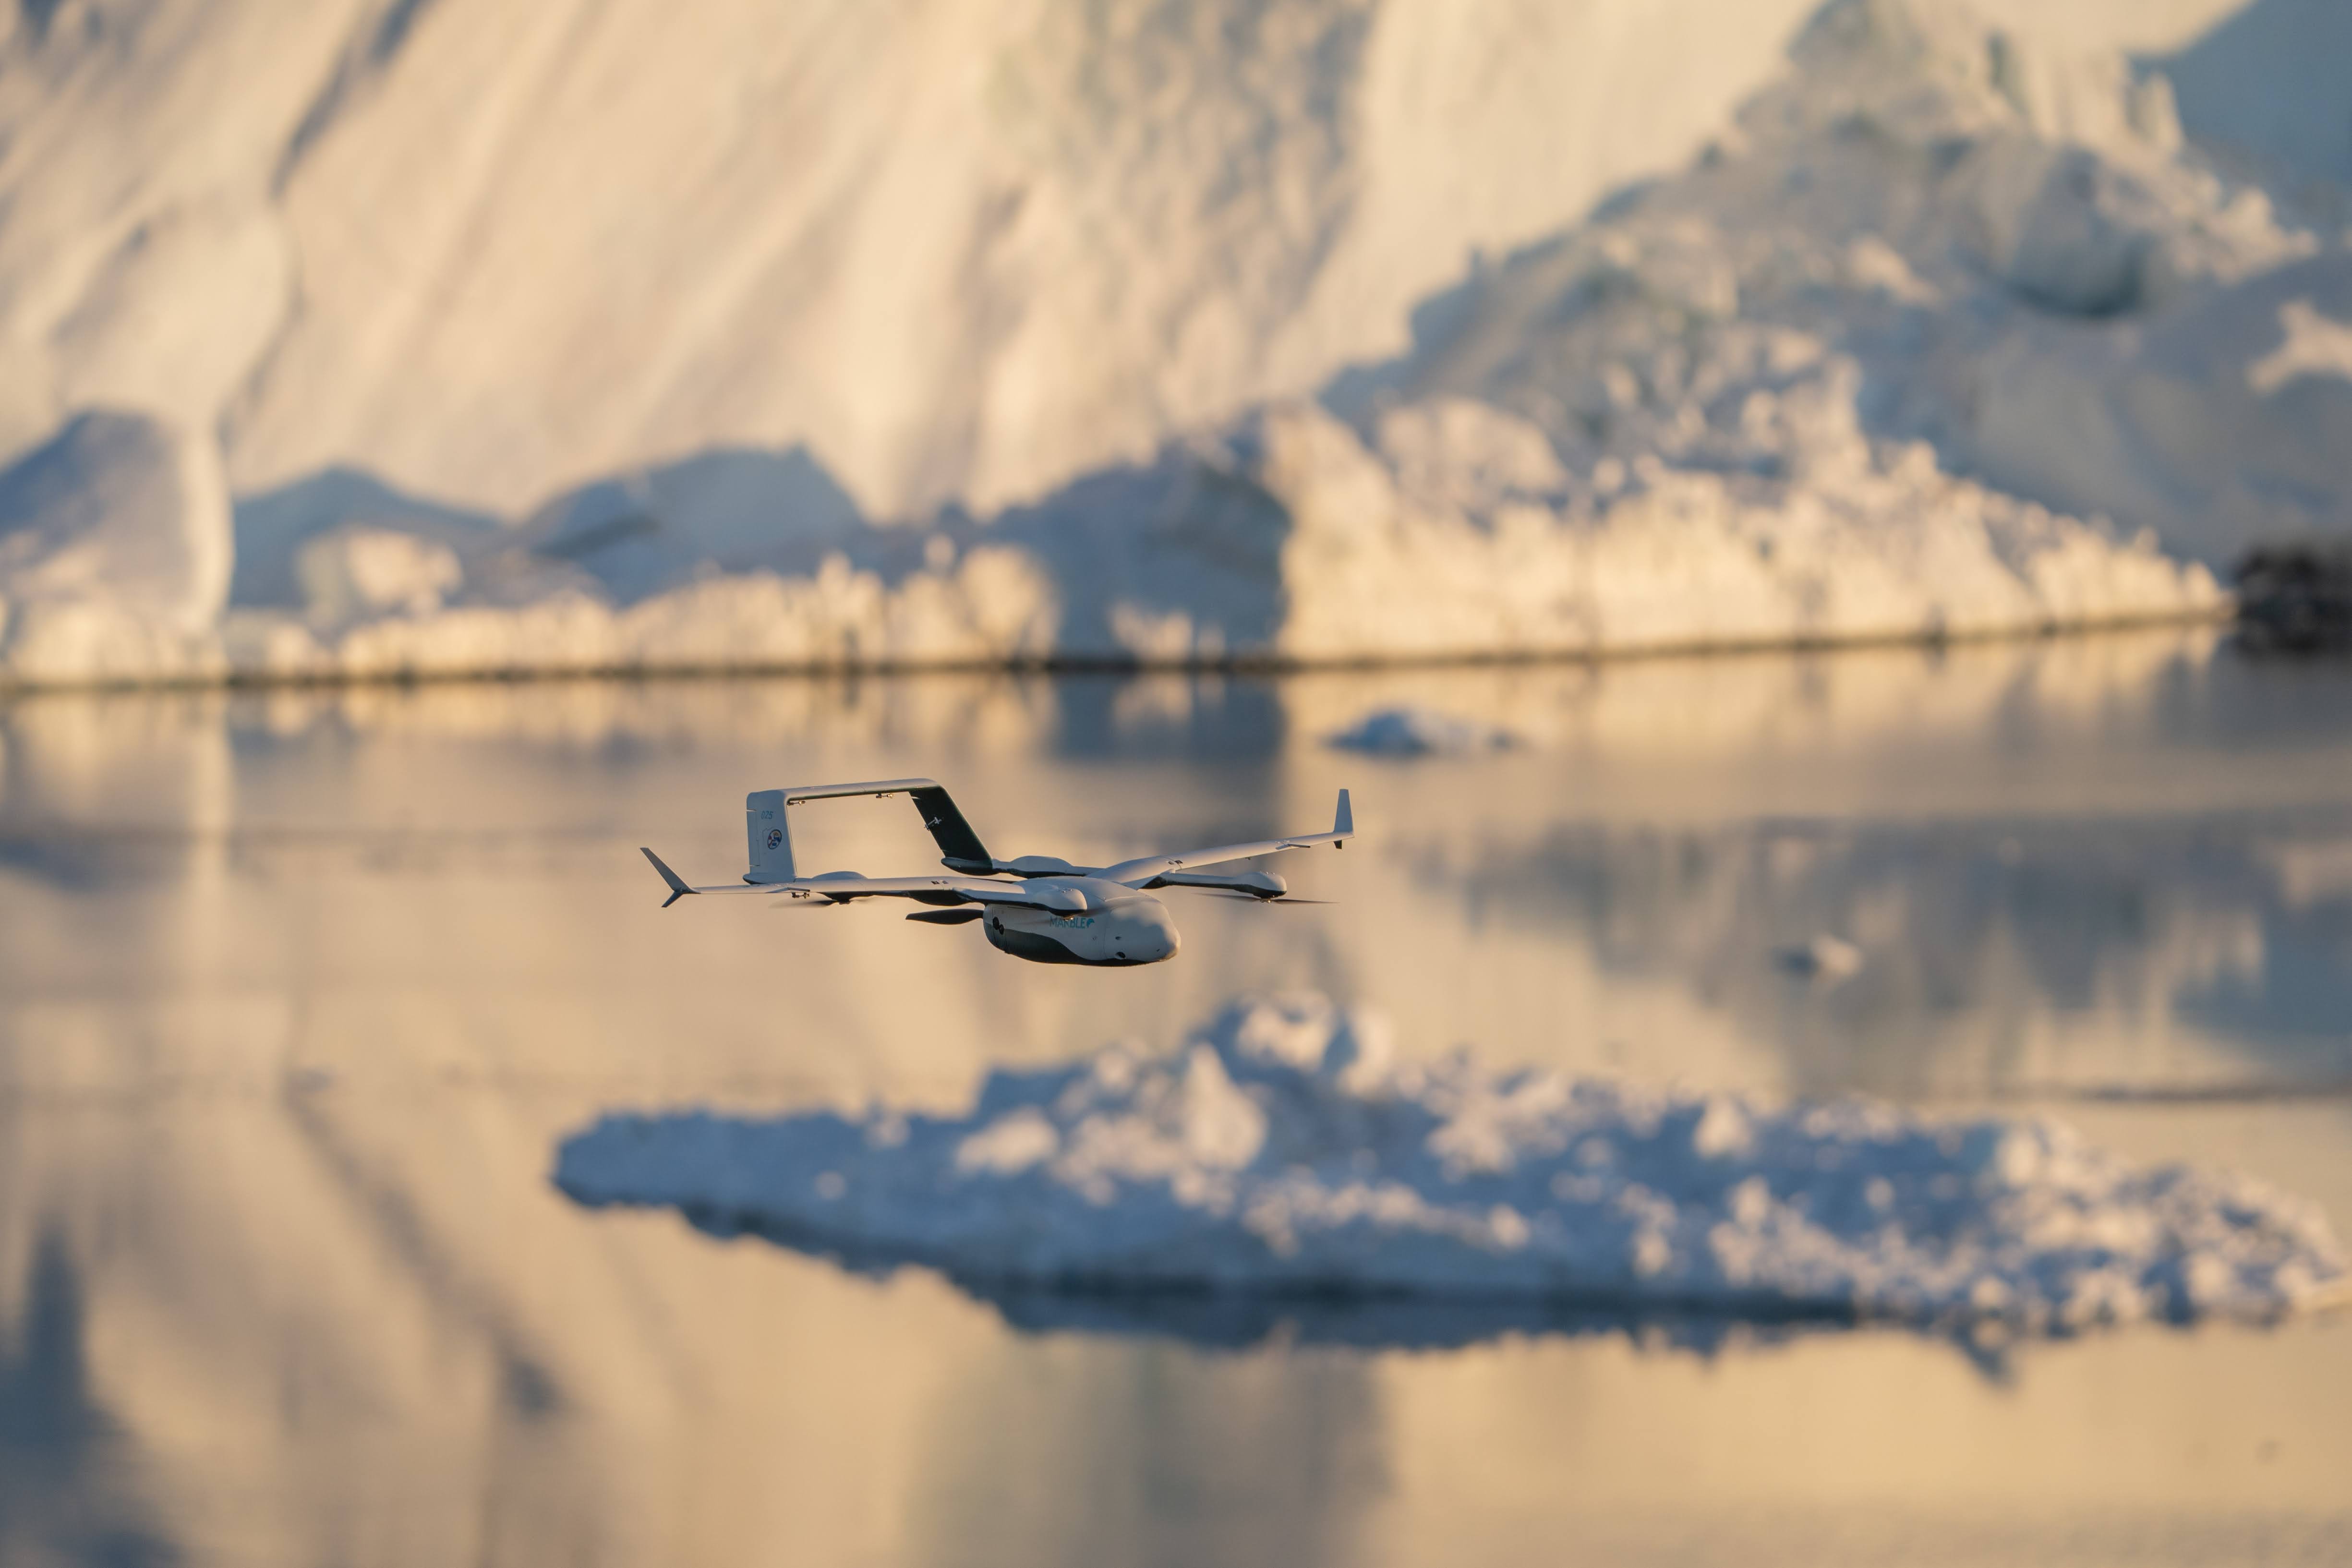
The Advanced Research + Invention Agency exists to fund frontier science that could benefit everyone. Their Scoping Our Planet opportunity space is a collective effort that supports scientists and engineers who use new technologies to: measure how the Earth is changing, help us to understand why it is changing, and provide the information that we all need to survive in a rapidly changing world. Through Launch 4 Change, university students develop and launch climate science payloads to explore new ways to measure our planet. They also mentor school pupils through UKROC, the youth rocketry competition. Our research teams are doing the same: creating new robots and computer models to assess how the oceans and ice sheets are changing and help to provide early warning of any future tipping point.

With a better understanding of the expected impacts of climate change, we can plan for the future. Governments can take a wide range of actions to adapt for future changes, from installing better flood defences, to securing future food production, to urban planning for cooler cities.
Every individual can help reduce the effects of climate change and build towards a more sustainable future. To cut emissions, we can all choose to change daily habits of food consumption, minimise waste, and prioritise electric transport options and renewable energy[4], [21]. Together, we can build a better future.